Introduction
“This time is different” is one of the most dangerous phrases in financial markets. It surfaces every time tech stocks surge, just as it did during the dot-com era of the late 1990s and the current AI boom. However, not all rallies are created equal.
A Boom and a Bubble may look similar on the surface, but their underlying structures are fundamentally different. This article clarifies the distinction between these two concepts using the dot-com era as a case study and evaluates the current state of the tech stock market.
Defining Booms and Bubbles
Characteristics of a Boom
An economic boom signifies sustainable economic growth based on solid fundamentals. During this period, the following characteristics emerge:
- Real Earnings Growth: Companies generate substantial revenue and net income.
- Reasonable Valuations: Stock prices rise in line with underlying earnings growth.
- Sound Capital Inflow: Investments are based on actual business performance.
- Gradual Adjustments: If growth slows, the market undergoes minor corrections with little structural damage.
Characteristics of a Bubble
A bubble is characterized by a rapid price increase far exceeding an asset’s intrinsic value:
- Disconnect from Fundamentals: Stock prices significantly outpace underlying earnings growth.
- Speculation-Driven Prices: Psychological factors, rather than actual value, determine prices.
- Indiscriminate Capital Inflow: Investments are driven by market sentiment alone, regardless of profitability.
- Sharp Collapse: The bubble bursts, causing widespread economic damage.
| Distinction | Boom | Bubble |
|---|---|---|
| Value Basis | Based on Fundamentals | Exceeds Fundamentals |
| Sustainability | Relatively Sustainable | Fundamentally Unsustainable |
| Profitability | Real Earnings Growth | Driven by Speculation Without Profit |
| Ending | Gradual Adjustment | Sharp Collapse |
| Investor Sentiment | Rational Optimism | Manic Euphoria |
The Unfolding of the Dot-Com Era
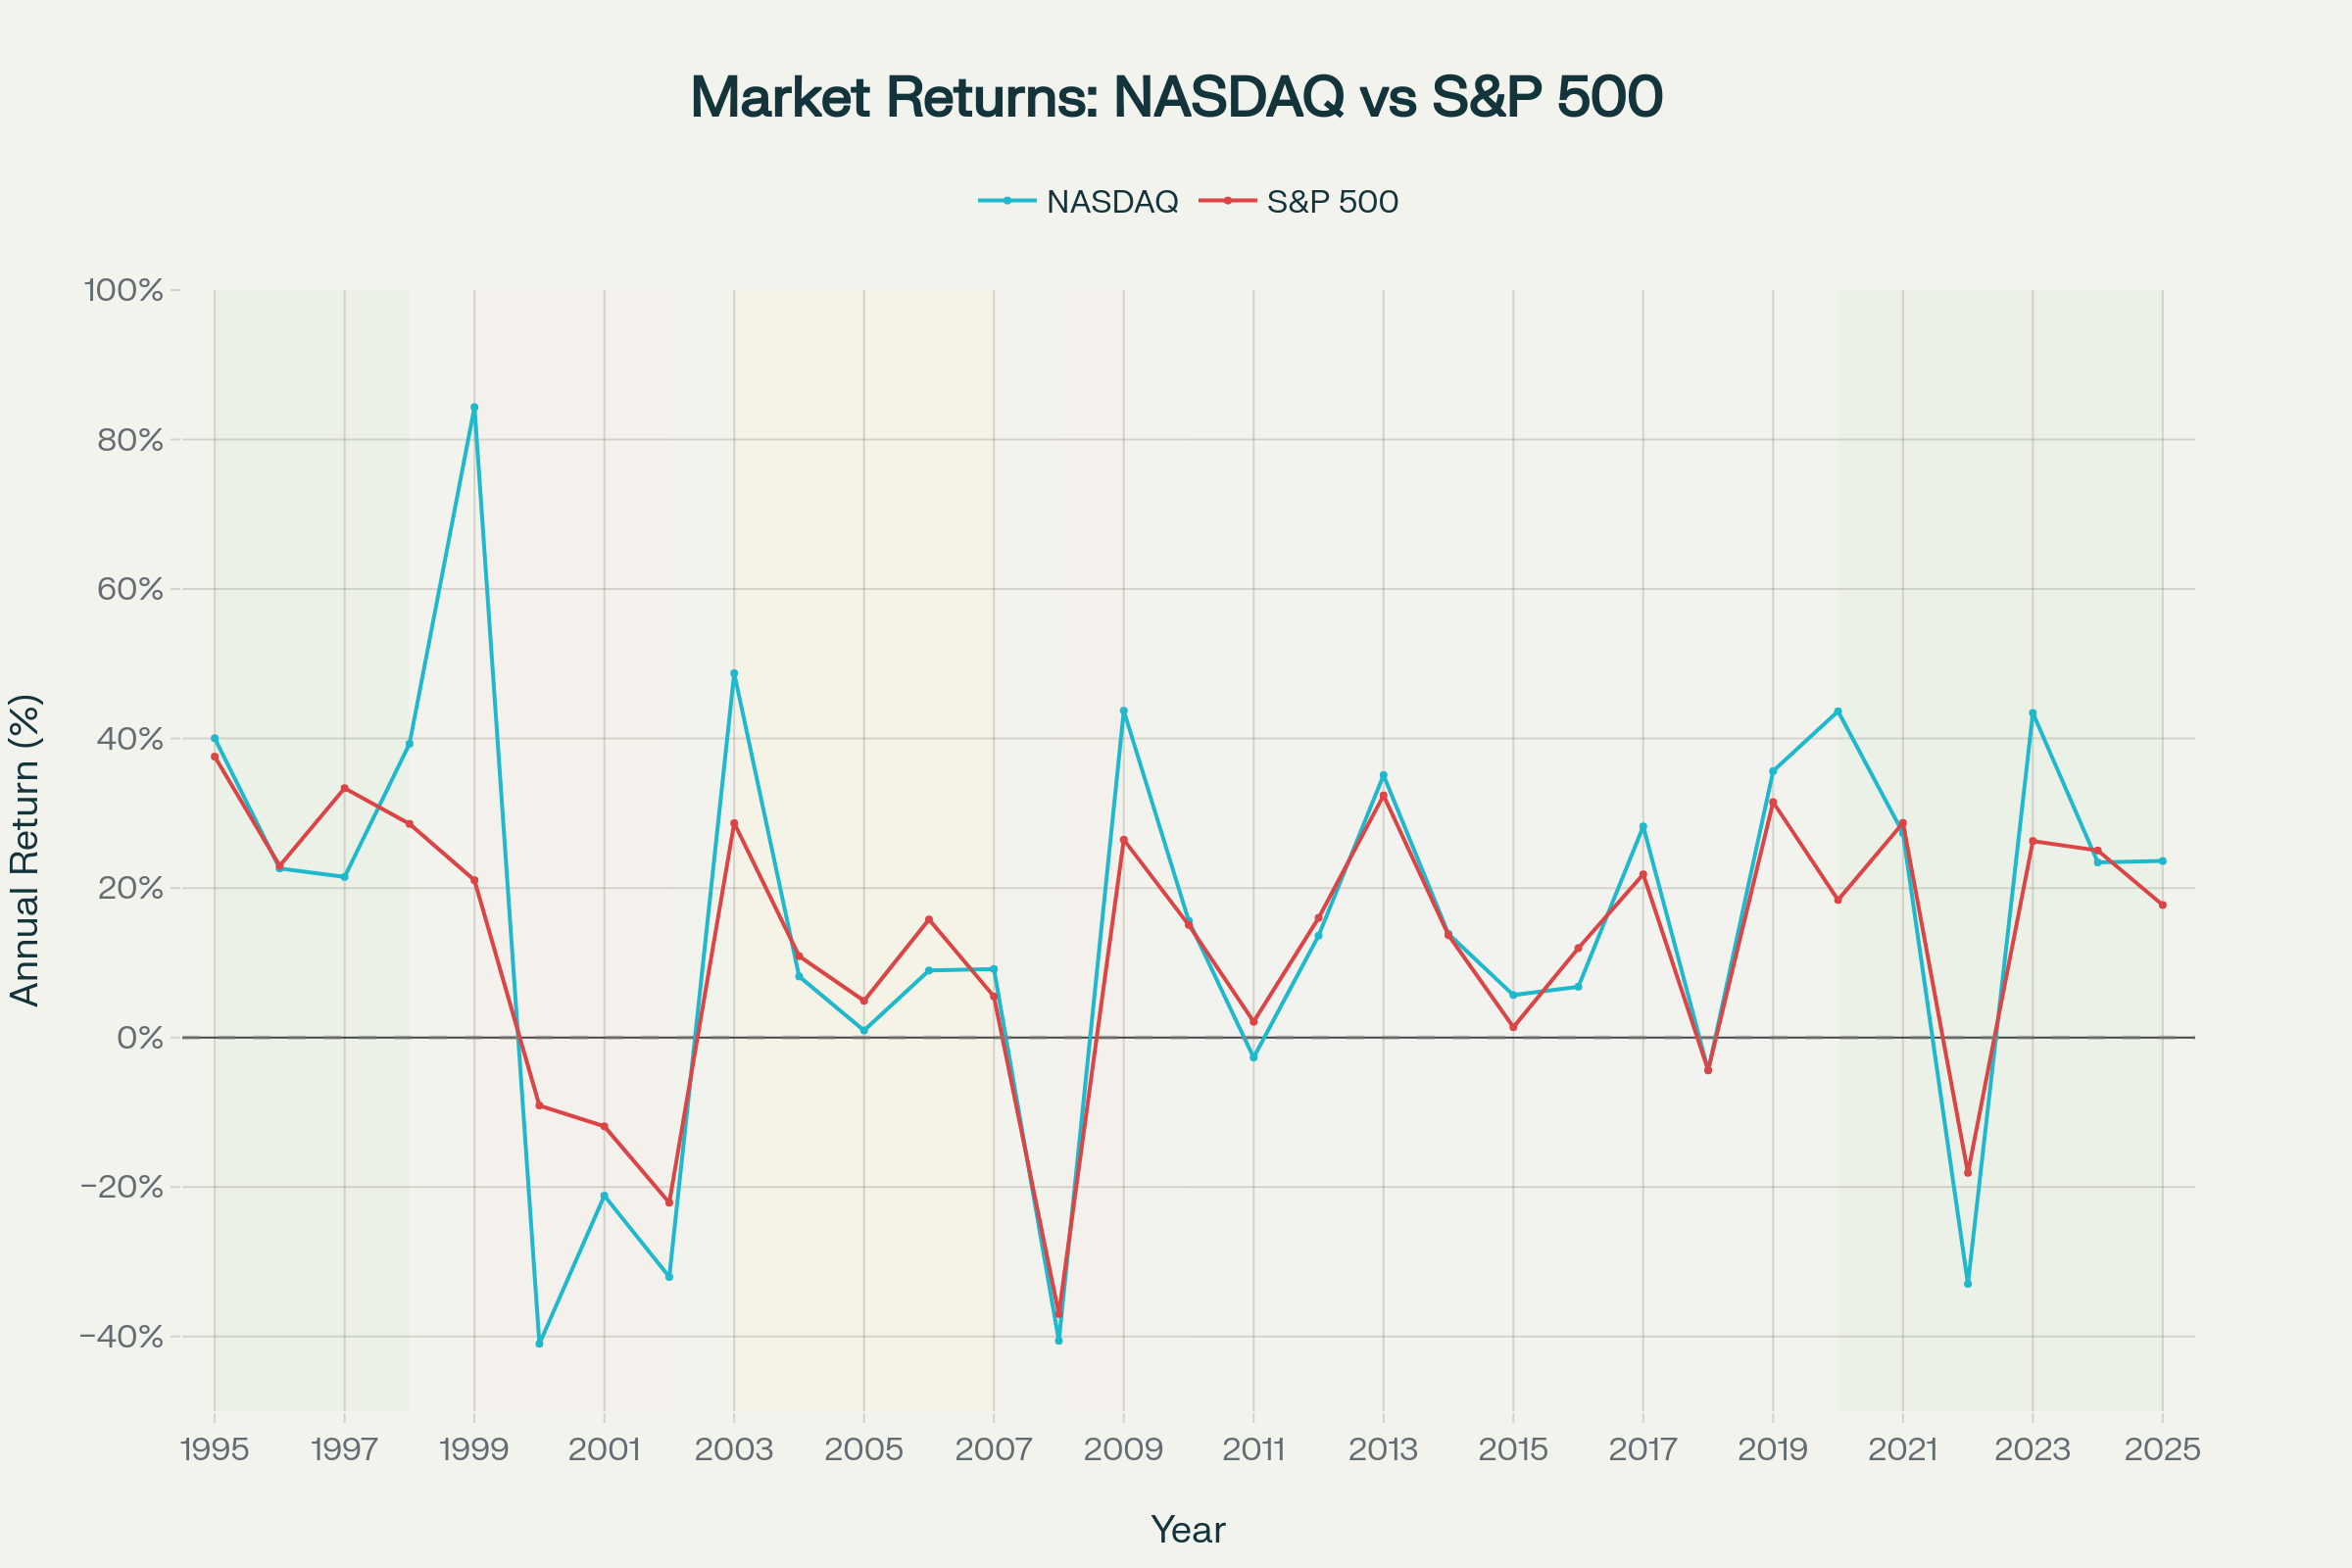 NASDAQ and S&P 500 Annual Returns (1995-2025): From Boom to Bubble to Modern Era
Stage 1: The Genuine Boom (1995-1998)
The early days of the dot-com era were truly revolutionary.
An Era of Technological Innovation
- 1989: Invention of the World Wide Web.
- 1993: Mosaic, 1994: Netscape Navigator—user-friendly web browsers emerged.
- This was genuinely industry-transforming technology.
The Rise of Real Companies
In 1995, companies like Amazon and Yahoo made e-commerce a reality. They were:
- Companies with complete business models.
- Businesses that started generating real profits over time.
- Valued as long-term investments with a clear vision.
Astonishing Returns
Looking at NASDAQ’s annual returns during this period:
| Year | NASDAQ Return | S&P 500 Return | Tech Sector Earnings Growth |
|---|---|---|---|
| 1995 | 40.04% | 33.80% | - |
| 1996 | 22.62% | 18.74% | - |
| 1997 | 21.48% | 30.88% | - |
| 1998 | 39.30% | 26.30% | - |
| Average | 30.86% | 27.43% | 42% Annually |
This incredible stock performance was perfectly justified by the 42% annual earnings growth of tech companies. The pace of stock price appreciation (30%) closely matched earnings growth (42%). This is the hallmark of a genuine boom.
Stage 2: The Transition to a Bubble (Late 1998 - March 2000)
The problem began after the low-interest-rate policy of 1998-1999.
The Reckless IPO Rush
- In 1999, most of the 451 IPOs were profitless internet companies.
- In the first quarter of 2000 alone, 91 new companies went public.
- Companies like Pets.com, Webvan, and eToys emerged.
A Shocking Phenomenon: Astronomical Valuations for Profitless Companies
These companies had common traits:
- No finished business model.
- No profits.
- No unique technology.
- Yet, they were given multi-billion dollar market caps.
How? They were valued on meaningless metrics like “brand recognition (eyeballs),” funded by spending 90% of their ad budgets.
The Dramatic Rise in P/E Ratios
While tech P/E ratios were reasonable from 1995-1998:
- March 2000 NASDAQ Tech P/E: 200x
- For comparison, the S&P 500 P/E was 30-40x.
- Profitless companies had infinite P/E ratios.
This is the definition of a bubble.
Stage 3: The Sharp Collapse (March 2000 - October 2002)
The Catastrophe
- March 2000 NASDAQ: 5,048.62 → October 2002: 1,139.90
- A 76.81% plunge.
- Investor losses: Approximately $5 trillion.
- It took 15 years for the NASDAQ to recover its 2000 peak.
Widespread Economic Damage
- Most dot-com companies failed.
- The venture capital industry collapsed.
- Employment and consumer spending contracted.
- The economic recession was exacerbated by the 9/11 attacks in 2001.
The Boom-to-Bubble Transition Mechanism in the Dot-Com Era
Did a Boom and a Bubble Coexist in the Same Industry?
Interestingly, the dot-com era saw a boom and a bubble existing simultaneously.
Common Traits of Surviving Companies
Companies like Amazon, Google, and eBay survived because:
- They had a revenue model from the start: They retained the characteristics of the initial boom.
- They created real customer value: They were not purely speculative assets.
- They had a scalable business: Their structure grew stronger over time.
Common Traits of Failed Companies
Companies like Pets.com and Webvan failed because:
- They had no revenue model from the beginning: They pursued market share exclusively.
- They lacked customer loyalty: Their business was not based on technology or service.
- Their model was unsustainable: They failed as soon as their funding dried up.
Change Over Time
1995-1998: Tech Innovation + Early Companies + High Growth + Reasonable Valuation → "Boom"
               ↓
1998-2000: Speculative Capital Inflow + Reckless IPOs + Profitless Companies + Extreme Valuation → "Bubble"
               ↓
2000-2002: Bubble Collapse + Widespread Losses + Structural Damage → "Crisis"
Evaluating the Current Tech Stock Market
Tech Sector Performance in 2024-2025
Solid Earnings Growth
Looking at the current tech sector’s performance:
| Metric | 2024 Performance | 2025 Forecast |
|---|---|---|
| Tech Sector Earnings Growth | +19.8% | +17.4% |
| Tech Sector Revenue Growth | - | +14.2% |
| Tech Sector Net Profit Margin | 25.3% | 25.8% (All-Time High) |
| S&P 500 Overall Growth | - | +10% Range |
The tech sector is significantly outpacing other S&P 500 sectors.
NASDAQ and Tech Stock Returns
| Period | NASDAQ/Tech Stock Return | Tech Earnings Growth |
|---|---|---|
| 2024 | 24.88% | 19.8% |
| 2025 YTD | 23.61% | - |
| 2-Year Average | ~24% | 17-20% |
Assessment: Stock prices and earnings growth are nearly aligned.
This is a characteristic of a boom. The stock price rally is supported by real earnings growth.
P/E Ratio Comparison
Current Tech Sector Valuation
| Benchmark | P/E Ratio | Assessment |
|---|---|---|
| Current (Nov 2025) | 41.83x | - |
| 5-Year Average | 30.89x | 35% higher than average |
| 10-Year Average | 24.31x | 72% higher than average |
| Historical Average | 18.86x | 122% higher than average |
| Dot-Com Bubble Peak | 200+x | 80% lower than peak |
Interpretation
- The tech sector is more expensive than its historical average (122% higher).
- However, it is far from the extreme levels of the dot-com bubble peak.
- The premium is reasonable given the current high earnings growth (17-20%) and margins (25.8%).
The Magnificent 7 Situation
Apple, Google, Microsoft, Meta, Amazon, Nvidia, Tesla
| Metric | Figure |
|---|---|
| 2024 Q4 Earnings Growth | +20.7% |
| 2024 Q4 Revenue Growth | +12.3% |
| Net Profit Margin | 25.8% |
| Forward P/E | 28.3x |
| S&P 500 (ex-Mag-7) P/E | 19.7x |
Assessment
The Magnificent 7’s P/E premium of 28.3x is justified because they maintain a net profit margin more than double that of other S&P 500 companies.
Comparing the Dot-Com Era and Today
A Three-Period Comparative Analysis
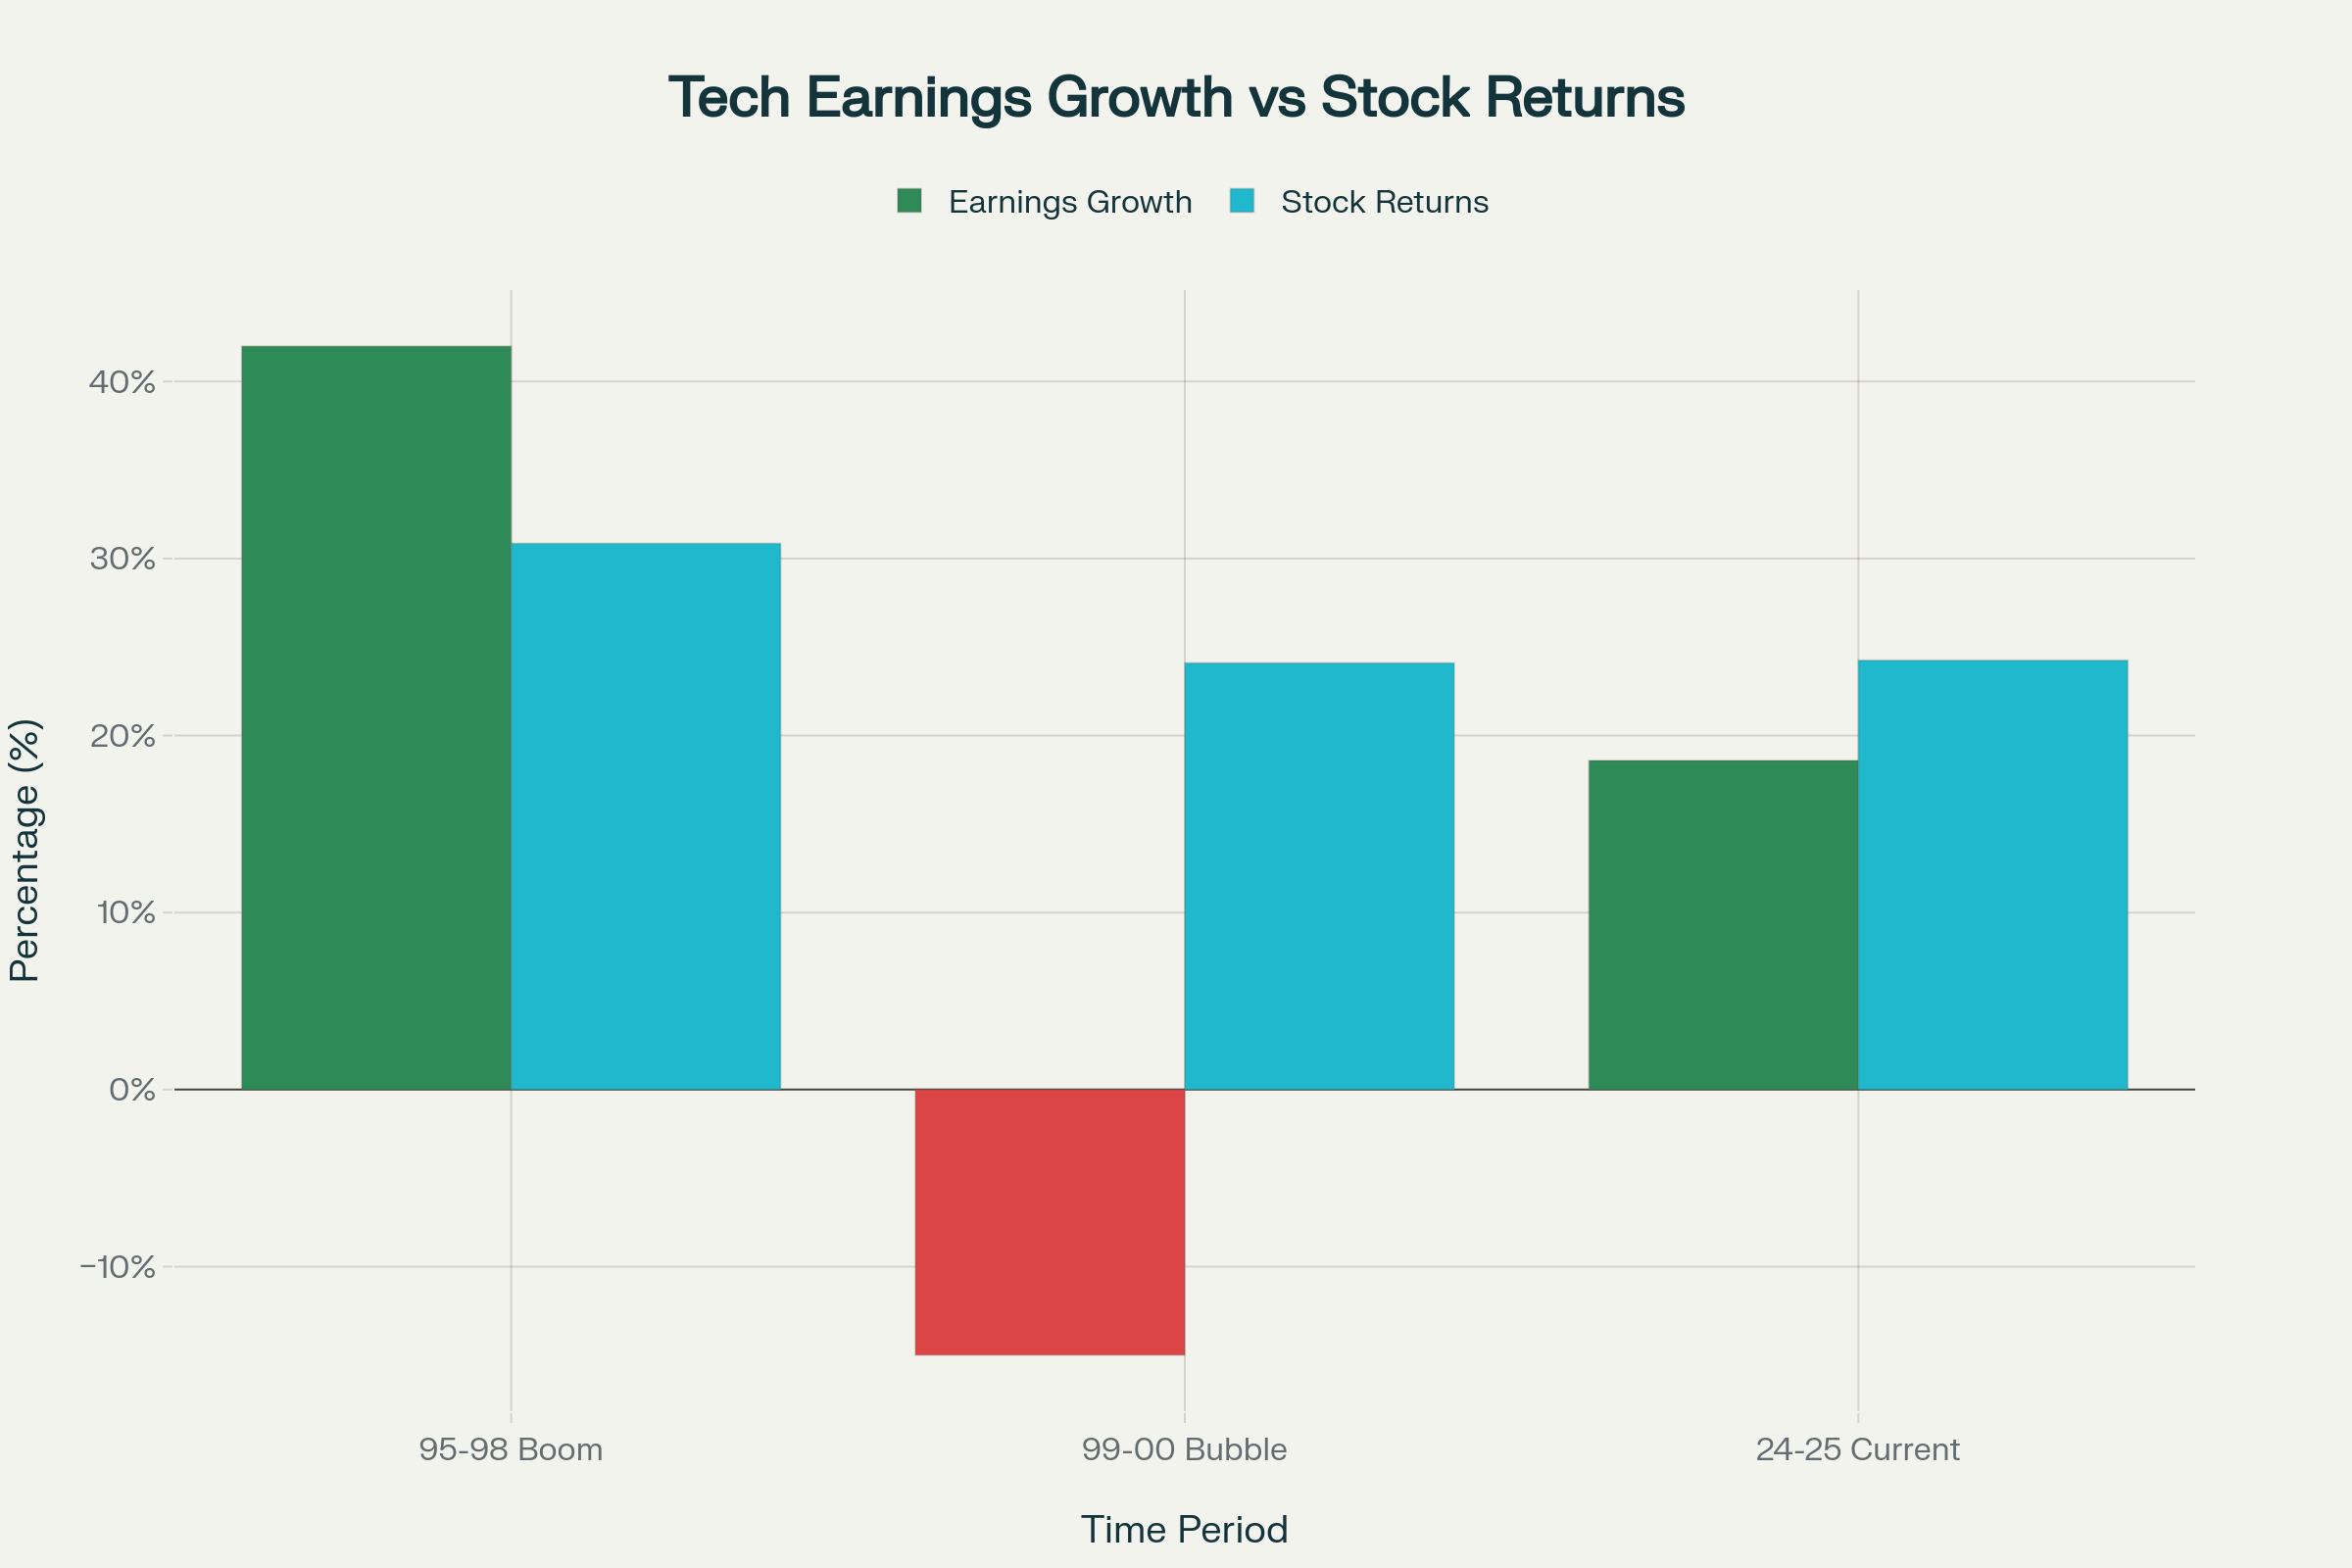 Technology Sector: Earnings Growth vs Stock Returns Comparison Across Three Periods
| Item | 1995-1998 Boom | 1999-2000 Bubble | 2024-2025 Present |
|---|---|---|---|
| Earnings Growth | 42% Annually | Declining Trend | 17-20% |
| Stock Return | 30.86% Average | 1999: 84%, 2000: -37% | 24% Average |
| Tech P/E | Reasonable | 200+ | 41.83x |
| Growth-Price Alignment | Perfect ✓ | Severe Mismatch ❌ | Good ✓ |
| Share of Profitless Companies | Low | Very High | Low |
| Bubble Characteristics | None | Extreme | None |
Conclusion on the Current Situation
The current tech stock market is more similar to the early boom of 1995-1998.
Reasons:
- Strong Fundamental Earnings Growth - 17-20% real growth.
- Reasonable Stock Price Appreciation - Aligned with earnings growth.
- High Profit Margins - 25.8% net profit margin.
- Real Profit-Generating Companies - Mostly leading firms.
- Healthy Growth Pattern - Based on performance, not speculation.
Warning Signs: Potential for Correction
However, the possibility of a correction is increasing:
- Increased Weight of Tech Stocks: Tech companies make up 32% of the S&P 500.
- Disconnect with Profit Share: Tech companies account for only 23% of total profits.
- Positive News Priced In: “A lot of good news is already reflected in the price.”
- High Valuation: P/E is 120% above the historical average.
Implication: While not a bubble, further upside is limited, and a future correction is possible.
Conclusion: How to Distinguish a Boom from a Bubble
What Investors Need to Know
The simplest way to tell a boom from a bubble:
-
Does underlying earnings growth keep up with stock price appreciation?
- If yes, it’s a boom ✓
- If it lags, it’s a bubble ✗
-
Are companies generating real profits?
- If yes, it’s a boom ✓
- If not, it’s a bubble ✗
-
Does the company’s valuation increase as its profits grow?
- If yes, it’s a boom ✓
- If valued regardless of profit, it’s a bubble ✗
Lessons from the Dot-Com Era
The dot-com era showed that a boom and a bubble can coexist within the same industry:
- Surviving Companies (Amazon, Google, eBay): Maintained early boom characteristics → Now have multi-trillion dollar market caps.
- Failed Companies (Pets.com, Webvan): Exhibited bubble characteristics → Completely vanished.
The key is fundamentals.
Final Assessment of the Present
The 2024-2025 tech stock market is:
✓ Not a bubble: Fundamental earnings growth justifies stock prices.
✓ In a boom: Real growth of 17-20% continues.
⚠ Correction risk: Expecting faster growth in the coming years is difficult.
⚠ Selectivity is crucial: Not all tech stocks hold the same value.
Conclusion: The current tech market is a boom within a normal range, but excessive optimism is risky.
Epilogue
In financial markets, one should always be wary of the phrase “this time is different.” At the same time, assuming “it will be the same as before” is also dangerous.
The current tech boom has similarities to the early 1990s. There is real technological innovation (AI, cloud), real corporate growth, and real profit increases.
However, the risk of a bubble inflating, as it did in the dot-com era, also exists. The possibility of a correction is high, especially if the monetization of AI fails to meet expectations or if market sentiment shifts abruptly.
A wise investor:
- Enjoys the boom (while it lasts).
- Stays alert for signs of a bubble (to detect it early).
- Always checks the fundamentals (does it follow the earnings?).
Perhaps this is the only lesson to be learned from history.
References
- https://www.frbsf.org/research-and-insights/publications/economic-letter/2001/06/the-stock-market-what-a-difference-a-year-makes/
- https://en.wikipedia.org/wiki/Dot-com_bubble
- https://www.ebsco.com/research-starters/economics/nasdaq-dive-prompts-dot-com-crash
- https://www.cambridge.org/core/books/boom-and-bust/dotcom-bubble/690BD009D795B9557E4A9B44A0D40FF9
- https://www.scirp.org/journal/paperinformation?paperid=127628
- https://papers.ssrn.com/sol3/Delivery.cfm/SSRN_ID1152412_code107353.pdf?abstractid=1152412
- https://www.slickcharts.com/nasdaq100/returns
- https://www.mckinsey.com/~/media/McKinsey/Featured%20Insights/Americas/US%20productivity%20growth%201995%202000/usprod.pdf
- https://www.iosrjournals.org/iosr-jhss/papers/Vol.28-Issue8/Ser-5/B2808050407.pdf
- https://www.nber.org/system/files/chapters/c0124/c0124.pdf
Disclaimer: This article is for general informational purposes only and does not constitute investment advice. The responsibility for all investment decisions rests with the investor, and the author assumes no liability for any direct or indirect losses incurred.