The wallstreetbets subreddit has recently been abuzz. News broke that the Hindenburg Omen has been triggered. This indicator is known for “predicting” the 1987 Black Monday and the 2008 financial crisis, leading investors to view it as an ominous sign of market collapse. But can this indicator truly be trusted? In this article, we will uncover the truth behind the Hindenburg Omen.
What is the Hindenburg Omen?
Reddit post The Hindenburg Omen image, https://www.reddit.com/r/wallstreetbets/comments/1oklex3/the_hindenburg_omen_an-indicator-that-correctly/
The Hindenburg Omen is an indicator developed in 2010 by technical analyst Jim Miekka. Its name is derived from the 1937 Hindenburg airship disaster, and it was intended to signal an ominous sign of market collapse.
For this indicator to be triggered, all of the following conditions must be met on the same day:
1) Market Uptrend: The NYSE index must be higher than its level 50 trading days (approximately 10 weeks) ago.
2) Surge in 52-Week Highs/Lows: At least 2.2-2.8% of stocks traded on the NYSE must simultaneously record 52-week highs, and at the same time, the same percentage must record 52-week lows. This signifies “indecision” in the market, meaning there are forces simultaneously buying and selling.
3) McClellan Oscillator is Negative: The McClellan Oscillator, which indicates market breadth, must fall below 0. This is a bearish signal.
4) New Highs are Less Than Twice New Lows: The number of new highs cannot exceed twice the number of new lows.
If these conditions occur more than twice within 36 days, the “Hindenburg Omen” is confirmed, interpreted as a “high probability of a significant decline within 40 days.”
The Surprising Truth: What 30 Years of Data Reveals
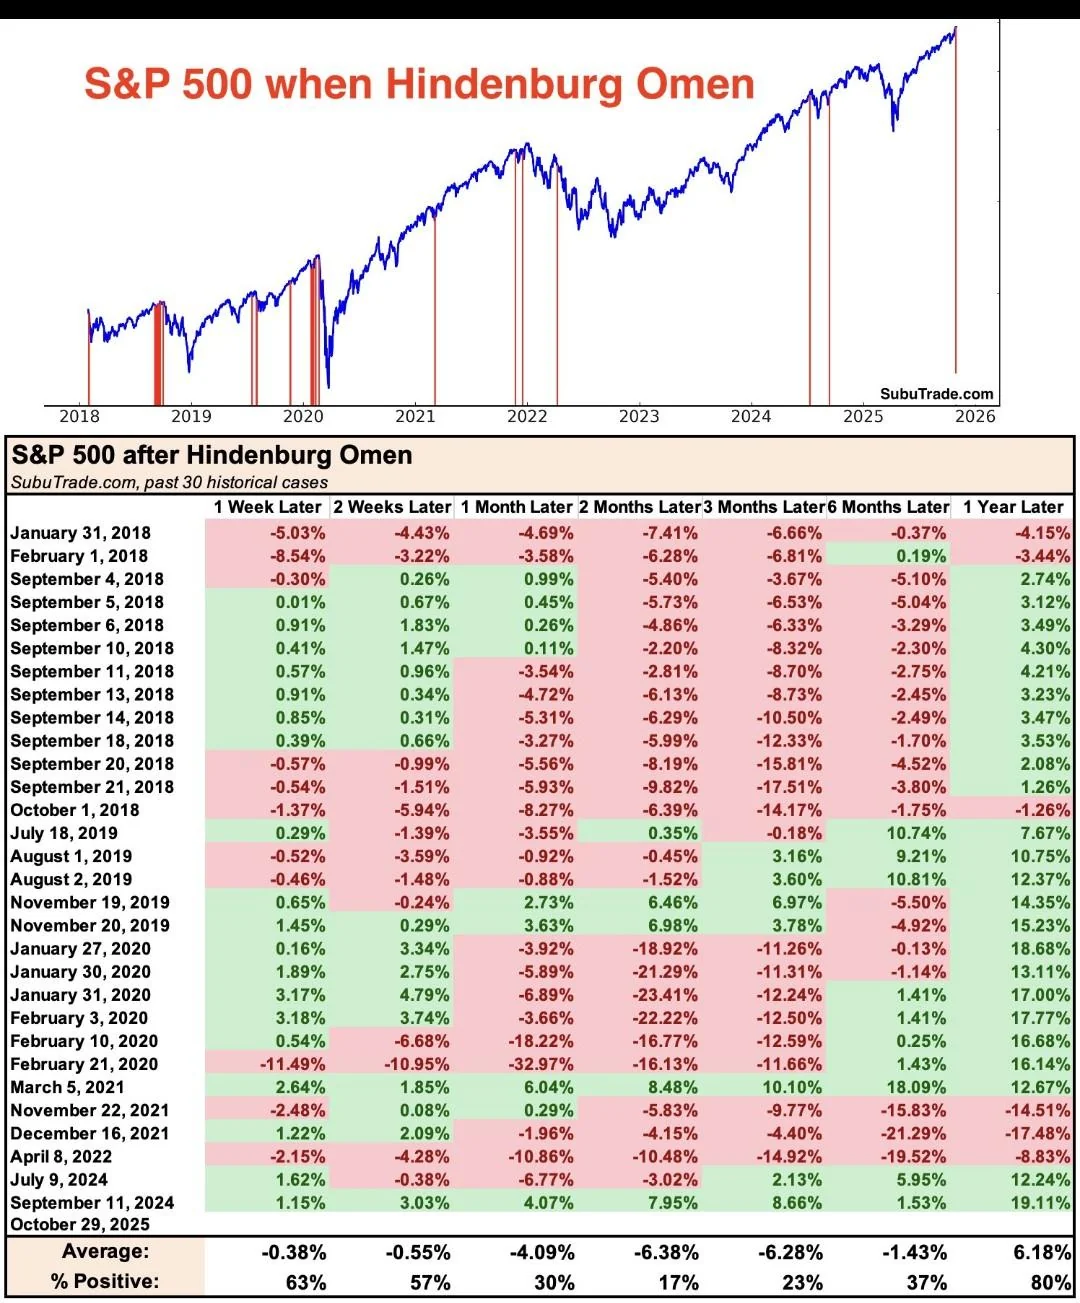
Here’s an important truth. Historical data from SubuTrade.com over the past 30 years shows that a total of 37 Hindenburg Omen signals were triggered.
So, how accurate was it really? Looking at the market’s reaction after the signals:
- 1 Week Later: 63% of cases saw a rise (average -0.38%)
- 2 Weeks Later: 57% of cases saw a rise (average -0.55%)
- 1 Month Later: 30% of cases saw a rise (average -4.09%)
- 2 Months Later: 17% of cases saw a rise (average -6.38%)
- 3 Months Later: 23% of cases saw a rise (average -6.28%)
- 6 Months Later: 37% of cases saw a rise (average -1.43%)
- 1 Year Later: 80% of cases saw a rise (average +6.18%)
Surprisingly, within one week of a signal, the market rose 63% of the time. This means that in the short term, it’s actually closer to a buy signal.
What’s more interesting is the long-term performance. After one year, the market rose in 80% of cases, with an average return of +6.18%. If you had sold your stocks in panic when the Hindenburg Omen was triggered, you would have lost out on gains 80% of the time.
In terms of accuracy, it only showed a 70-83% probability of a decline in the 1-2 month period. In other words, this indicator is only somewhat valid for a very limited period (1-3 months), and before or after that, it actually has the opposite effect.
Multiple Signals = More Reliable Warning?
The developers of the Hindenburg Omen placed more emphasis on multiple signals occurring within 30 days rather than a single signal. This can be seen as a “double-check” mechanism.
However, caution is still needed here. Multiple signals do not necessarily mean a collapse is imminent. For example, the Hindenburg Omen was confirmed for the first time in 3 years in December 2024, but investor reactions may differ from initial expectations.
Interesting Data: Cases Where the Market Rose Even After a Signal
This is where it gets really interesting. There are quite a few cases where the market rose even after a Hindenburg Omen signal.
- January-February 2020: A Hindenburg signal was triggered, but the S&P 500 recorded short-term gains.
- September 2024: A signal was triggered, but the market rose at the time.
Indeed, studies show that the market rose in about 30-40% of cases after a signal.
More specifically, on average after a signal:
- 1 week later: S&P 500 declined by an average of 0.38%
- 3 weeks later: declined by an average of 4.09%
- 6 months later: declined by an average of 6.28%
This suggests a pattern of gradual decline rather than an immediate collapse after a signal. More precisely, the largest declines occur between 3 weeks and 6 months after the signal.
Why Does It Fail in Modern Markets?
Interestingly, the Hindenburg Omen detected past crises well, but has become increasingly less effective since its inception in 2010.
What are the reasons?
1) Rise of ETFs: The surge in Exchange-Traded Funds has distorted the measurement of market breadth.
2) Algorithms and High-Frequency Trading (HFT): These create rapid price movements regardless of human decision-making. These movements do not match the patterns the Hindenburg Omen was designed to detect.
3) Regulatory Changes and Central Bank Policies Since 2008: Regulatory authorities and central bank interventions have created different market behaviors than in the past.
Lessons from History: 1987 and 2008
Did the Hindenburg Omen truly predict the 1987 Black Monday and the 2008 financial crisis? The answer is “it seems plausible in hindsight, but it hasn’t been very accurate since the indicator was developed.”
Notably, the Hindenburg Omen did signal the early stages of the COVID-19 collapse in February 2020 and just before the 2022 bear market in December 2021. These two cases were relatively accurate. However, there were numerous false signals in between.
What Investors Should Do
1) Do Not Rely Solely on It: The Hindenburg Omen is merely a “red flag.” It is dangerous to short or liquidate positions based solely on this.
2) Review with Other Indicators: It should be considered comprehensively with other technical analysis indicators, fundamental analysis, and so on.
3) Do Not Fall into Psychological Traps: Whenever this indicator is heavily reported in the media, investors panic and sometimes sell prematurely. However, this does not automatically mean a market collapse. In fact, the market rose in 30-40% of cases.
Conclusion
The Hindenburg Omen has captivated investors with its appealing name and historical background. However, a sober look at the data reveals that it is not a highly reliable indicator.
- In the short term (1 week) and long term (1 year), the market shows a strong tendency to rise.
- The accuracy of predicting declines is limited to 70-83% only in the 1-2 month period.
- Increasingly less effective due to changes in modern market structure
Investing should be based on data, not fear. There is no reason to panic sell just because the Hindenburg Omen has sounded. Instead, it is wise to use it as a signal to re-examine the risks in your portfolio and to conduct broader market analysis.
Indicators are merely tools to aid our judgment, not crystal balls that show the future.
References
- Investopedia - “Be Aware of the Hindenburg Omen” https://www.investopedia.com/articles/trading/07/hindenburgomen.asp
- Humble Student of the Markets - “Rethinking the Hindenburg Omen” https://humblestudentofthemarkets.com/2022/01/22/rethinking-the-hindenburg-omen/
- ChartSchool StockCharts - “Hindenburg Omen” https://chartschool.stockcharts.com/table-of-contents/trading-strategies-and-models/trading-strategies/hindenburg-omen
- Morpher Blog - “The Hindenburg Omen: A Deep Dive into Market Fear” https://www.morpher.com/blog/unveiling-the-hindenburg-omen
- Economic Times - “What is Hindenburg Omen that was triggered yesterday” https://economictimes.com/news/international/us/stock-market-crash-signal-what-is-hindenburg-omen-that-was-triggered-yesterday-if-you-are-an-investor-do-take-note/articleshow/125001343.cms
Disclaimer: This article is for general informational purposes only and does not constitute investment advice. The responsibility for all investment decisions rests with the investor, and the author assumes no liability for any direct or indirect losses incurred.